
Report mig interannual summary : no historical data for month/ week if no fish was observed
This is in fun_report_mig_interannual I think we have to change the merge to a right_join
Activity
changed milestone to %stacomir0.6.1
added development enhancement labels
assigned to @cedric.briand

currently in the summary I don't see migration for other month but historically it was there
Edited by cedricbriandgithub-
TODO list
-
I've renamed all to english in functions
summaryandfun_report_mig_interannual=> check where they are called and that arguments are corrected - Tests for report mig mult
-
Remove function
ref_periodused only in report_mig_interannual also from collate fields - Re run poedit for translated fields
- Check that calls from the function still work in reports and in the shiny
- Ensure use of day, week month ... instead of french in code in plot
- Test plots
Edited by cedricbriandgithub -
I've renamed all to english in functions
-
== Testing test-06-report_mig_interannual.R ====================================
[ FAIL 0 | WARN 0 | SKIP 0 | PASS 26 ] Done!
version of the package changed to Version: 0.6.1.9000 (dev version)
TEST AFTER CORRECTION

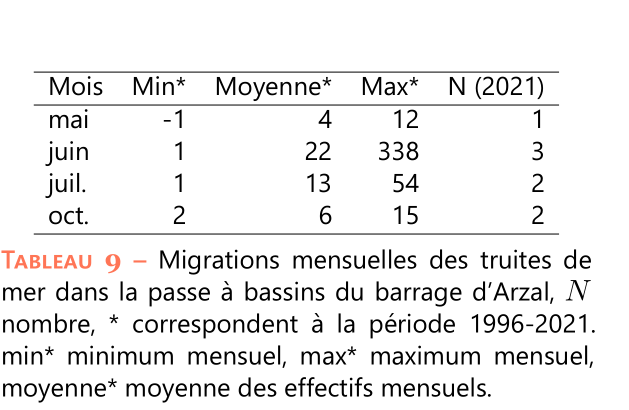
\begin{table}[ht]
\centering
\begin{tabular}{rlrrrl}
  \hline
 & Mois & Min* & Moyenne* & Max* & N (2021) \\
  \hline
1 & mars & -5 & -2 & 1 &  \\
  6 & avr. & -1 & 0 & 3 &  \\
  19 & mai & -1 & 4 & 12 &  \\
  35 & juin & 1 & 22 & 338 &  \\
  53 & juil. & 1 & 13 & 54 &  \\
  63 & août & 1 & 3 & 7 &  \\
  64 & sept. & 1 & 1 & 1 &  \\
  70 & oct. & 2 & 6 & 15 &  \\
  74 & nov. & 1 & 5 & 8 &  \\
   \hline
\end{tabular}
\caption{Migrations mensuelles des truites de mer dans la passe à bassins du barrage d'Arzal, $N$ nombre, * correspondent à
				la période 1996-2021. min* minimum mensuel, max* maximum mensuel, moyenne* moyenne des effectifs mensuels.}
\label{table_trm_mois}
\end{table}


FIXED

% latex table generated in R 4.1.2 by xtable 1.8-4 package
% Wed Aug 10 19:26:06 2022
\begin{table}[ht]
\centering
\begin{tabular}{rlrrrr}
  \hline
 & Mois & Min* & Moyenne* & Max* & N (2021) \\
  \hline
1 & mars & -5 & -2 & 1 &  \\
  6 & avr. & -1 & 0 & 3 &  \\
  24 & mai & -1 & 4 & 12 & 1 \\
  43 & juin & 1 & 22 & 338 & 3 \\
  56 & juil. & 1 & 14 & 54 & 2 \\
  63 & août & 1 & 3 & 7 &  \\
  64 & sept. & 1 & 1 & 1 &  \\
  68 & oct. & 2 & 6 & 15 & 2 \\
  74 & nov. & 1 & 5 & 8 &  \\
   \hline
\end{tabular}
\caption{Migrations mensuelles des truites de mer dans la passe à bassins du barrage d'Arzal, $N$ nombre, * correspondent à
				la période 1996-2021. min* minimum mensuel, max* maximum mensuel, moyenne* moyenne des effectifs mensuels.}
\label{table_trm_mois}
\end{table}
Edited by cedricbriandgithub closed with commit 36b1661c
mentioned in commit a13c90ba
Please register or sign in to reply